

Could a Blind Algorithm be Better Than Brazilian Regulators?
An Essay on Unsupervised Machine Learning and Corporate Fraud in Brazil


In January 2023, Brazil woke up to a financial apocalipse. What had long been treated as one of the country’s most emblematic retail champions suddenly disclosed accounting inconsistencies that would later be measured in the tens of billions of reais. Creditors froze lines, equity holders were wiped out in days of all value, and the firm entered judicial reorganization in what quickly became one of the largest corporate collapses in Brazilian history. The name at the center of the storm was Americanas S.A.
In the immediate aftermath, the public debate followed a very predictable script. Commentators asked how such a large discrepancy could have gone unnoticed. Analysts revisited old earnings calls in search of missed clues. Politicians demanded accountability and more regulation. Regulators pointed to disclosure rules and missed information. Auditors emphasized procedures and technical standards. The Brazilian SEC, the Comissão de Valores Mobiliários (CVM), initiated formal inquiries. The company’s long-time external auditor, KPMG, found itself under intense scrutiny.
Yet beneath the legal arguments and institutional defenses lies a simpler and more uncomfortable question: Americanas’ accounting information was public and audited, so how could no regulator or major market player have seen this before?! Where were the alarm systems? Was anyone really watching?
I then decided to test a simple question: Would a blind machine, with no information about Americanas, make the same mistake?
I decided to approach this question without privileged information, whistleblower testimony, or ex post labels of fraud through an unsupervised machine learning system. I used only what any investor, analyst, or regulator could have accessed at the time: published financial statements. I constructed a balanced panel of eleven Brazilian listed companies over the period 2013–2022, yielding 87 firm-year observations after data cleaning. The sample included large retailers such as Magazine Luiza S.A. and other comparably visible firms.
From each firm-year was extracted four financial ratios designed to capture the interaction between leverage, financing costs, and operating performance. The first was the short-term debt ratio, measuring current financial obligations relative to assets. The second was the long-term debt ratio, capturing the structural weight of non-current liabilities. The third variable, which I called “financial weight,” proxied the burden of financial expenses relative to operating scale. The fourth, “implicit margin,” approximated profitability net of financial costs. These are not exotic constructs. They are the kind of ratios routinely calculated in introductory corporate finance courses.
Instead of asking the model to predict fraud, I asked it a more modest question: which observations look statistically unusual relative to the rest of the cross-section and over time? To answer this, I employed four standard unsupervised anomaly detection techniques: One-Class SVM, Local Outlier Factor, Isolation Forest, and Gaussian Mixture Models. Each method captures abnormality from a different geometric or probabilistic perspective. One-Class SVM learns the boundary of “normality” in feature space. LOF evaluates local density deviations. Isolation Forest isolates observations via recursive partitioning. Gaussian mixtures assess likelihood under estimated distributional regimes.
I then aggregated their outputs into a normalized Ensemble Score between zero and one, where higher values indicate greater statistical abnormality. This aggregation reduces method-specific noise and emphasizes consensus signals across techniques.
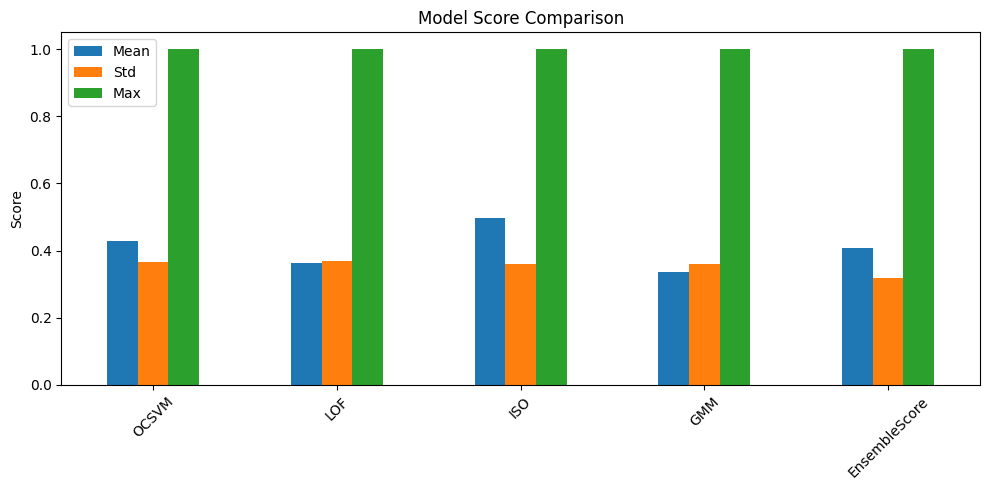
The results are difficult to ignore. Across the full 2013–2022 sample, Americanas S.A. exhibits the highest average Ensemble Score of all firms in the dataset, with a mean score of 0,680. By contrast, the dataset average across all eleven companies is 0,406, and the second-highest average score, that of Magazine Luiza S.A, is 0,584. Not only is Americanas materially higher than the cross-sectional mean, it also maintains a persistent lead over its closest peer across the decade.
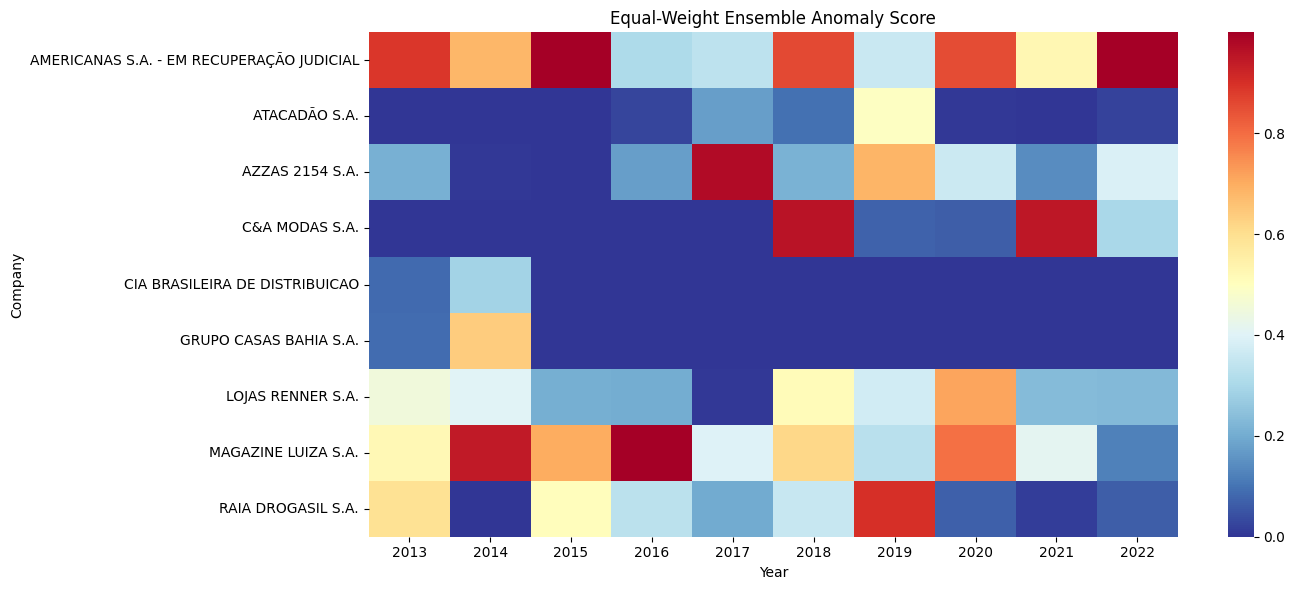
More strikingly, in 2015 all four independent algorithms simultaneously assigned Americanas S.A. the maximum anomaly score of 1 within the cross-section. This was the only instance in the entire dataset of 87 firm-year observations in which every method unanimously classified a firm-year as extreme. At the time, there was no public scandal narrative: earnings calls were proceeding normally and credit markets were open. Yet, in purely statistical terms, the configuration of leverage and financial burden relative to margins was an outlier.
One could argue that such a signal might be noise. And indeed, that is precisely what we see with Magazine Luiza S.A. Magalu also received a high anomaly score in one year of the sample, peaking at a perfect ensemble score in 2016, but its subsequent years returned to values much closer to the cross-sectional norm. That pattern is consistent with a transient structural shift tied to aggressive expansion and investment in e-commerce and digital channels, not persistent financial inconsistency.
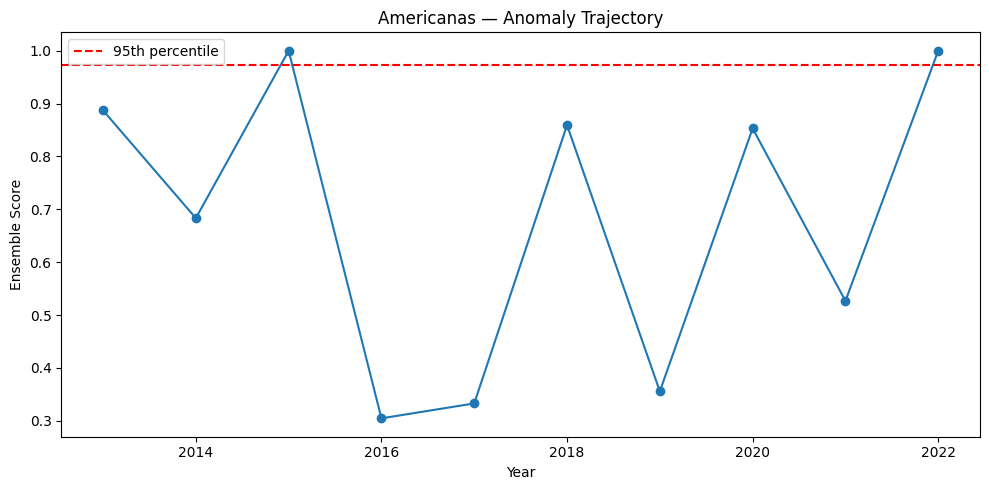
In the case of Americanas, however, unlike Magazine Luiza’s temporary excursion, the elevated anomaly scores do not dissipate after a single year; they cluster repeatedly across multiple years, and in 2022 they rise again to cross statistically significant thresholds. The persistence of high anomaly scores across many periods strengthens the interpretation that this is not merely random noise or transitory operational dynamics, but rather a structural departure from peer norms that survives across time.
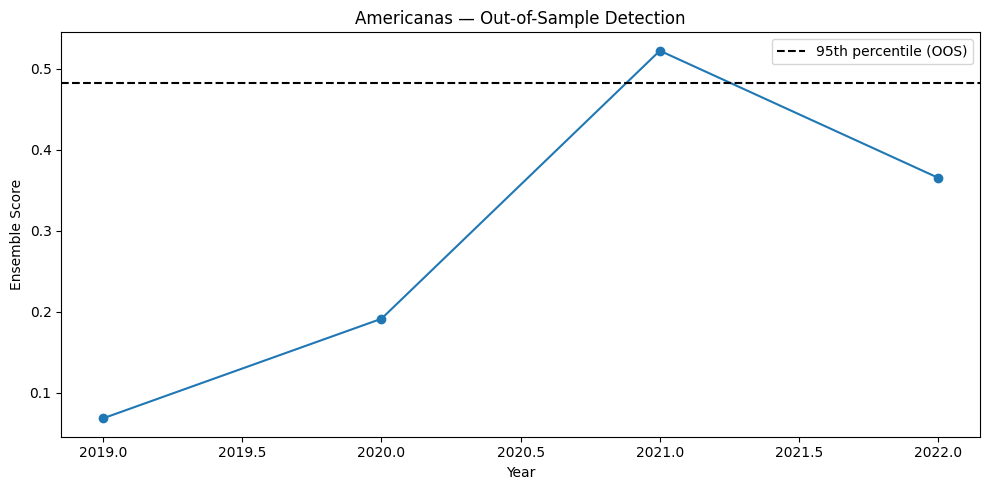
One might argue that such findings are contaminated by hindsight, that the model, having seen the entire sample including the crisis years, is merely overfitting to what we now know. To address this concern, I conducted an out-of-sample exercise. I trained the ensemble exclusively on data from 2013–2018 and then applied it blindly to the period 2019–2022. This simulates a real-time monitoring environment in which the future is unknown at the moment of estimation.
The trajectory that emerges from the out-of-sample test is very revealing. Using only data up to 2018 to define what “normal” looks like, Americanas S.A.’s anomaly score in 2019 was 0.07, a level comfortably within historical norms and well below typical alert thresholds. In 2020, the score rose to 0.19, but it still remained below the empirical 95th-percentile cutoff. Then, in 2021, the anomaly score jumped sharply to 0.52, crossing the 95th percentile alert threshold of approximately 0.48, based solely on the training distribution. In other words, a backward-looking system that learned normality only from 2013–2018 would have generated a statistically significant abnormality signal for Americanas in 2021, a full year before the public disclosure that detonated the market in January 2023.
It is important to emphasize what this does and does not mean. An anomaly score is not a legal verdict. Statistical abnormality can arise from aggressive expansion, strategic restructuring, or temporary shocks. High scores, as said, are signals for investigation, not convictions of wrongdoing.
However, the presence of false positives does not negate the informational value of persistent, multi-method outliers. Financial supervision, by its nature, operates under uncertainty. Regulators do not need certainty of fraud to justify deeper scrutiny. They require structured, defensible criteria for allocating limited investigative resources. An unsupervised anomaly framework provides precisely that: a transparent, replicable filter highlighting firm-year observations whose financial architecture deviates materially from peers and historical patterns. It is a alarm system.
The broader implication concerns institutional design. The CVM already receives standardized financial statements. Computational costs for running anomaly detection on a few dozen ratios across listed firms are trivial relative to the scale of capital markets. An automated system could compute cross-sectional anomaly percentiles quarterly, generating a prioritized review list. Firms breaching a pre-specified threshold could be asked to provide additional reconciliations or clarifications. Such a mechanism would not replace audits or enforcement; it would complement them with systematic statistical surveillance.
The Americanas case is therefore not merely a story of accounting irregularities. It is a test of whether modern financial oversight incorporates the analytical tools already commonplace in other domains. Banks deploy anomaly detection for anti-money laundering. E-commerce platforms use it to flag fraudulent transactions in milliseconds. Yet capital market supervision often remains anchored in reactive, complaint-driven processes.
What my experiment suggests is unsettling in its simplicity. Using four ordinary financial ratios and off-the-shelf unsupervised algorithms, one can generate a persistent abnormality signal for a major listed corporation years before its collapse becomes public knowledge. The data were not hidden. The mathematics were not exotic. The exercise required no privileged access, only attention!
SUMMARY
Mean Std Max
OCSVM 0.428492 0.366618 1.0
LOF 0.364271 0.368413 1.0
ISO 0.496863 0.359368 1.0
GMM 0.335726 0.359503 1.0
EnsembleScore 0.406338 0.316968 1.0
SCORES BY COMPANY
OCSVM \
mean std max
Company
AMERICANAS S.A. - EM RECUPERAÇÃO JUDICIAL 0.650567 0.347789 1.000000
ATACADÃO S.A. 0.146696 0.216800 0.525246
AZZAS 2154 S.A. 0.362614 0.370920 1.000000
C&A MODAS S.A. 0.368502 0.507654 1.000000
CIA BRASILEIRA DE DISTRIBUICAO 0.000000 0.000000 0.000000
GRUPO CASAS BAHIA S.A. 0.467542 0.331480 0.701933
LOJAS RENNER S.A. 0.466044 0.336330 1.000000
MAGAZINE LUIZA S.A. 0.680101 0.353722 1.000000
RAIA DROGASIL S.A. 0.272699 0.212763 0.603291
LOF \
mean std max
Company
AMERICANAS S.A. - EM RECUPERAÇÃO JUDICIAL 0.672959 0.304590 1.000000
ATACADÃO S.A. 0.091900 0.132019 0.334412
AZZAS 2154 S.A. 0.245252 0.331717 1.000000
C&A MODAS S.A. 0.493511 0.463873 1.000000
CIA BRASILEIRA DE DISTRIBUICAO 0.397358 0.351665 0.646022
GRUPO CASAS BAHIA S.A. 0.516361 0.683970 1.000000
LOJAS RENNER S.A. 0.188829 0.209620 0.602501
MAGAZINE LUIZA S.A. 0.474465 0.396270 1.000000
RAIA DROGASIL S.A. 0.324921 0.404170 1.000000
ISO \
mean std max
Company
AMERICANAS S.A. - EM RECUPERAÇÃO JUDICIAL 0.789961 0.284164 1.000000
ATACADÃO S.A. 0.089793 0.153225 0.364466
AZZAS 2154 S.A. 0.331454 0.326677 0.903569
C&A MODAS S.A. 0.515821 0.430864 0.994818
CIA BRASILEIRA DE DISTRIBUICAO 0.301872 0.153886 0.410686
GRUPO CASAS BAHIA S.A. 0.255533 0.361378 0.511066
LOJAS RENNER S.A. 0.453431 0.203289 0.696127
MAGAZINE LUIZA S.A. 0.778788 0.295212 1.000000
RAIA DROGASIL S.A. 0.493032 0.367997 1.000000
GMM \
mean std max
Company
AMERICANAS S.A. - EM RECUPERAÇÃO JUDICIAL 0.607847 0.413202 1.000000
ATACADÃO S.A. 0.142162 0.320552 0.860090
AZZAS 2154 S.A. 0.322443 0.333713 1.000000
C&A MODAS S.A. 0.500603 0.481001 1.000000
CIA BRASILEIRA DE DISTRIBUICAO 0.042857 0.060608 0.085713
GRUPO CASAS BAHIA S.A. 0.213925 0.191231 0.349146
LOJAS RENNER S.A. 0.221921 0.241298 0.701915
MAGAZINE LUIZA S.A. 0.402049 0.377845 1.000000
RAIA DROGASIL S.A. 0.251986 0.308866 1.000000
EnsembleScore
mean std max
Company
AMERICANAS S.A. - EM RECUPERAÇÃO JUDICIAL 0.680333 0.278797 1.000000
ATACADÃO S.A. 0.117638 0.176859 0.493366
AZZAS 2154 S.A. 0.315441 0.307171 0.975892
C&A MODAS S.A. 0.469609 0.452420 0.959331
CIA BRASILEIRA DE DISTRIBUICAO 0.185522 0.141540 0.285605
GRUPO CASAS BAHIA S.A. 0.363340 0.392015 0.640536
LOJAS RENNER S.A. 0.332556 0.199407 0.712244
MAGAZINE LUIZA S.A. 0.583851 0.280224 1.000000
RAIA DROGASIL S.A. 0.335660 0.292409 0.900823
SCORES BY YEAR
OCSVM LOF ISO \
mean std max mean std max mean std
Year
2013 0.418289 0.322194 1.0 0.365544 0.391762 1.0 0.489863 0.362371
2014 0.390564 0.391774 1.0 0.638465 0.363106 1.0 0.590415 0.375478
2015 0.431269 0.393211 1.0 0.489296 0.451463 1.0 0.598477 0.396452
2016 0.408501 0.329696 1.0 0.312808 0.365926 1.0 0.378664 0.366920
2017 0.230521 0.381589 1.0 0.325607 0.380434 1.0 0.549333 0.365477
2018 0.576945 0.333324 1.0 0.366030 0.379547 1.0 0.594343 0.438269
2019 0.621463 0.346826 1.0 0.340924 0.320297 1.0 0.471757 0.334469
2020 0.391246 0.410400 1.0 0.430033 0.387270 1.0 0.460777 0.394882
2021 0.526447 0.461903 1.0 0.158044 0.372970 1.0 0.473670 0.381298
2022 0.253916 0.339295 1.0 0.277978 0.352519 1.0 0.394340 0.367192
GMM EnsembleScore
max mean std max mean std max
Year
2013 1.0 0.344905 0.326957 1.0 0.404650 0.295727 0.887145
2014 1.0 0.358628 0.363659 1.0 0.494518 0.331228 0.944470
2015 1.0 0.413572 0.393349 1.0 0.483154 0.395709 1.000000
2016 1.0 0.254902 0.372254 1.0 0.338719 0.341394 1.000000
2017 1.0 0.283841 0.359737 1.0 0.347325 0.336692 0.975892
2018 1.0 0.522026 0.390809 1.0 0.514836 0.321421 0.959331
2019 1.0 0.399150 0.418216 1.0 0.458324 0.268424 0.900823
2020 1.0 0.351171 0.371386 1.0 0.408307 0.373332 0.853037
2021 1.0 0.144395 0.377307 1.0 0.325639 0.337225 0.949575
2022 1.0 0.291224 0.348862 1.0 0.304365 0.333124 1.000000
TOP 3 ANOMALIES PER YEAR
OCSVM LOF ISO \
Year Company
2013 AMERICANAS S.A. - EM RECUPERAÇÃO JUDICIAL 1.000000 0.824764 0.723815
MAGAZINE LUIZA S.A. 0.438079 0.283657 1.000000
RAIA DROGASIL S.A. 0.224851 1.000000 0.724619
2014 AMERICANAS S.A. - EM RECUPERAÇÃO JUDICIAL 0.329720 0.919018 0.973483
GRUPO CASAS BAHIA S.A. 0.701933 1.000000 0.511066
MAGAZINE LUIZA S.A. 1.000000 0.777881 1.000000
2015 AMERICANAS S.A. - EM RECUPERAÇÃO JUDICIAL 1.000000 1.000000 1.000000
MAGAZINE LUIZA S.A. 0.522353 0.905767 0.789289
RAIA DROGASIL S.A. 0.510125 0.421568 0.792434
2016 AMERICANAS S.A. - EM RECUPERAÇÃO JUDICIAL 0.254174 0.419052 0.334400
MAGAZINE LUIZA S.A. 1.000000 1.000000 1.000000
RAIA DROGASIL S.A. 0.371901 0.238765 0.592560
2017 AMERICANAS S.A. - EM RECUPERAÇÃO JUDICIAL 0.107622 0.529968 0.493496
AZZAS 2154 S.A. 1.000000 1.000000 0.903569
MAGAZINE LUIZA S.A. 0.166951 0.195143 1.000000
2018 AMERICANAS S.A. - EM RECUPERAÇÃO JUDICIAL 0.721751 0.804047 1.000000
C&A MODAS S.A. 0.842508 1.000000 0.994818
MAGAZINE LUIZA S.A. 1.000000 0.266251 0.966645
2019 ATACADÃO S.A. 0.525246 0.334412 0.253718
AZZAS 2154 S.A. 1.000000 0.349182 0.793928
RAIA DROGASIL S.A. 0.603291 1.000000 1.000000
2020 AMERICANAS S.A. - EM RECUPERAÇÃO JUDICIAL 0.642353 0.769797 1.000000
LOJAS RENNER S.A. 1.000000 0.602501 0.696127
MAGAZINE LUIZA S.A. 0.777304 1.000000 0.840054
2021 AMERICANAS S.A. - EM RECUPERAÇÃO JUDICIAL 1.000000 0.096983 1.000000
C&A MODAS S.A. 1.000000 1.000000 0.798301
MAGAZINE LUIZA S.A. 1.000000 0.008839 0.642220
2022 AMERICANAS S.A. - EM RECUPERAÇÃO JUDICIAL 1.000000 1.000000 1.000000
AZZAS 2154 S.A. 0.258614 0.471537 0.494063
C&A MODAS S.A. 0.000000 0.127538 0.654811
GMM EnsembleScore Rank
Year Company
2013 AMERICANAS S.A. - EM RECUPERAÇÃO JUDICIAL 1.000000 0.887145 1.0
MAGAZINE LUIZA S.A. 0.365284 0.521755 3.0
RAIA DROGASIL S.A. 0.416519 0.591497 2.0
2014 AMERICANAS S.A. - EM RECUPERAÇÃO JUDICIAL 0.511251 0.683368 2.0
GRUPO CASAS BAHIA S.A. 0.349146 0.640536 3.0
MAGAZINE LUIZA S.A. 1.000000 0.944470 1.0
2015 AMERICANAS S.A. - EM RECUPERAÇÃO JUDICIAL 1.000000 1.000000 1.0
MAGAZINE LUIZA S.A. 0.593730 0.702785 2.0
RAIA DROGASIL S.A. 0.304841 0.507242 3.0
2016 AMERICANAS S.A. - EM RECUPERAÇÃO JUDICIAL 0.211479 0.304776 3.0
MAGAZINE LUIZA S.A. 1.000000 1.000000 1.0
RAIA DROGASIL S.A. 0.111936 0.328791 2.0
2017 AMERICANAS S.A. - EM RECUPERAÇÃO JUDICIAL 0.200888 0.332994 3.0
AZZAS 2154 S.A. 1.000000 0.975892 1.0
MAGAZINE LUIZA S.A. 0.230820 0.398228 2.0
2018 AMERICANAS S.A. - EM RECUPERAÇÃO JUDICIAL 0.911387 0.859296 2.0
C&A MODAS S.A. 1.000000 0.959331 1.0
MAGAZINE LUIZA S.A. 0.221170 0.613516 3.0
2019 ATACADÃO S.A. 0.860090 0.493366 3.0
AZZAS 2154 S.A. 0.603378 0.686622 2.0
RAIA DROGASIL S.A. 1.000000 0.900823 1.0
2020 AMERICANAS S.A. - EM RECUPERAÇÃO JUDICIAL 1.000000 0.853037 1.0
LOJAS RENNER S.A. 0.550350 0.712244 3.0
MAGAZINE LUIZA S.A. 0.557201 0.793640 2.0
2021 AMERICANAS S.A. - EM RECUPERAÇÃO JUDICIAL 0.010633 0.526904 2.0
C&A MODAS S.A. 1.000000 0.949575 1.0
MAGAZINE LUIZA S.A. 0.000129 0.412797 3.0
2022 AMERICANAS S.A. - EM RECUPERAÇÃO JUDICIAL 1.000000 1.000000 1.0
AZZAS 2154 S.A. 0.338167 0.390595 2.0
C&A MODAS S.A. 0.414832 0.299295 3.0
CORRELATION MATRIX
OCSVM LOF ISO GMM EnsembleScore
OCSVM 1.000000 0.542507 0.708175 0.629502 0.826020
LOF 0.542507 1.000000 0.706495 0.817546 0.879511
ISO 0.708175 0.706495 1.000000 0.682112 0.886920
GMM 0.629502 0.817546 0.682112 1.000000 0.896473
EnsembleScore 0.826020 0.879511 0.886920 0.896473 1.000000
Financial Ratios – Global Summary:
ShortTermDebtRatio LongTermDebtRatio FinancialWeight ImplicitMargin
count 87.000000 87.000000 87.000000 87.000000
mean 0.492931 0.366103 -1.665897 4.101233
std 0.166644 0.203898 31.066566 35.753431
min 0.133464 0.000000 -270.429869 -33.493163
25% 0.373282 0.194642 -0.829335 0.672482
50% 0.490561 0.351470 -0.241740 0.724586
75% 0.645540 0.533814 -0.080817 0.800592
max 0.763093 0.753203 85.987066 331.996973
Financial Ratios By Company:
ShortTermDebtRatio \
mean std
DENOM_CIA
AMERICANAS S.A. - EM RECUPERAÇÃO JUDICIAL 0.588199 0.160728
ATACADÃO S.A. 0.566495 0.062214
AZZAS 2154 S.A. 0.345763 0.062235
C&A MODAS S.A. 0.489694 0.071354
CIA BRASILEIRA DE DISTRIBUICAO 0.500831 0.035020
FERTILIZANTES HERINGER S.A. 0.417351 0.028991
GRUPO CASAS BAHIA S.A. 0.422589 0.016354
LOJAS RENNER S.A. 0.264083 0.051271
MAGAZINE LUIZA S.A. 0.625436 0.120393
RAIA DROGASIL S.A. 0.683826 0.041839
\
min max count
DENOM_CIA
AMERICANAS S.A. - EM RECUPERAÇÃO JUDICIAL 0.133464 0.763093 13
ATACADÃO S.A. 0.441755 0.622417 7
AZZAS 2154 S.A. 0.242312 0.437987 13
C&A MODAS S.A. 0.387897 0.580002 5
CIA BRASILEIRA DE DISTRIBUICAO 0.465052 0.558621 5
FERTILIZANTES HERINGER S.A. 0.384422 0.439032 3
GRUPO CASAS BAHIA S.A. 0.403345 0.447891 5
LOJAS RENNER S.A. 0.221035 0.403432 13
MAGAZINE LUIZA S.A. 0.368215 0.761839 12
RAIA DROGASIL S.A. 0.620164 0.739506 11
LongTermDebtRatio \
mean std
DENOM_CIA
AMERICANAS S.A. - EM RECUPERAÇÃO JUDICIAL 0.586997 0.197783
ATACADÃO S.A. 0.231207 0.074977
AZZAS 2154 S.A. 0.313136 0.178297
C&A MODAS S.A. 0.384717 0.226466
CIA BRASILEIRA DE DISTRIBUICAO 0.403582 0.138624
FERTILIZANTES HERINGER S.A. 0.151965 0.145658
GRUPO CASAS BAHIA S.A. 0.255697 0.128421
LOJAS RENNER S.A. 0.559844 0.111898
MAGAZINE LUIZA S.A. 0.274789 0.149693
RAIA DROGASIL S.A. 0.207225 0.057005
\
min max count
DENOM_CIA
AMERICANAS S.A. - EM RECUPERAÇÃO JUDICIAL 0.000000 0.753203 13
ATACADÃO S.A. 0.097449 0.297693 7
AZZAS 2154 S.A. 0.014119 0.590688 13
C&A MODAS S.A. 0.002378 0.604675 5
CIA BRASILEIRA DE DISTRIBUICAO 0.190447 0.513102 5
FERTILIZANTES HERINGER S.A. 0.003206 0.294311 3
GRUPO CASAS BAHIA S.A. 0.067058 0.401498 5
LOJAS RENNER S.A. 0.343334 0.713084 13
MAGAZINE LUIZA S.A. 0.002298 0.422591 12
RAIA DROGASIL S.A. 0.135239 0.333551 11
FinancialWeight \
mean std
DENOM_CIA
AMERICANAS S.A. - EM RECUPERAÇÃO JUDICIAL 8.029745 23.689426
ATACADÃO S.A. -0.632425 0.510583
AZZAS 2154 S.A. -0.310498 0.481168
C&A MODAS S.A. -51.453633 122.567138
CIA BRASILEIRA DE DISTRIBUICAO -1.373693 0.612077
FERTILIZANTES HERINGER S.A. 12.091665 28.079391
GRUPO CASAS BAHIA S.A. -0.960372 3.556037
LOJAS RENNER S.A. -0.252193 0.223965
MAGAZINE LUIZA S.A. -0.075469 4.754329
RAIA DROGASIL S.A. -0.364419 0.210991
\
min max count
DENOM_CIA
AMERICANAS S.A. - EM RECUPERAÇÃO JUDICIAL -9.812826 85.987066 13
ATACADÃO S.A. -1.617515 -0.195936 7
AZZAS 2154 S.A. -1.889402 -0.086615 13
C&A MODAS S.A. -270.429869 13.895439 5
CIA BRASILEIRA DE DISTRIBUICAO -2.393520 -0.879407 5
FERTILIZANTES HERINGER S.A. -5.042055 44.497127 3
GRUPO CASAS BAHIA S.A. -5.987552 4.001647 5
LOJAS RENNER S.A. -0.871130 -0.028923 13
MAGAZINE LUIZA S.A. -8.048459 9.487017 12
RAIA DROGASIL S.A. -0.787541 -0.118404 11
ImplicitMargin \
mean std
DENOM_CIA
AMERICANAS S.A. - EM RECUPERAÇÃO JUDICIAL -1.900203 9.493492
ATACADÃO S.A. 0.705206 0.062894
AZZAS 2154 S.A. 0.781682 0.072373
C&A MODAS S.A. 66.816349 148.240810
CIA BRASILEIRA DE DISTRIBUICAO 0.794759 0.097212
FERTILIZANTES HERINGER S.A. 0.553875 0.229583
GRUPO CASAS BAHIA S.A. 0.636987 0.041224
LOJAS RENNER S.A. 0.764396 0.106021
MAGAZINE LUIZA S.A. 0.409617 1.022101
RAIA DROGASIL S.A. 0.786999 0.086804
min max count
DENOM_CIA
AMERICANAS S.A. - EM RECUPERAÇÃO JUDICIAL -33.493163 1.030146 13
ATACADÃO S.A. 0.582712 0.777188 7
AZZAS 2154 S.A. 0.698211 0.893559 13
C&A MODAS S.A. -0.019156 331.996973 5
CIA BRASILEIRA DE DISTRIBUICAO 0.689860 0.894366 5
FERTILIZANTES HERINGER S.A. 0.289199 0.699191 3
GRUPO CASAS BAHIA S.A. 0.585719 0.678575 5
LOJAS RENNER S.A. 0.665683 0.989465 13
MAGAZINE LUIZA S.A. -2.704380 1.122821 12
RAIA DROGASIL S.A. 0.663329 1.005824 11
Definitely a case of "nobody" wanting the see the obvious. As is/was the case with Banco Master, the Fictor SCPs, and many others. Astute market participants were avoiding these traps months (sometimes years) before each crisis came to light. The regulators, no so much.
Absolutely spot-on analysis and conclusion.
This is really great